Data Analysis
The fastest way to understand what's really in your data. The Data Analysis module is your first stop for data exploration – a specialized tool that can parse thousands of XML and JSON files in seconds to instantly reveal structure, patterns, and content that would take hours to discover manually.
Unlike heavyweight BI platforms that require extensive setup and configuration, this module gets you answers immediately. Whether you're a data analyst facing an unknown dataset, a developer debugging API responses, or a business user trying to understand legacy data exports, you'll have insights within seconds of upload.
Perfect for early-stage data discovery – understand your data first, then move to your preferred analysis tools with confidence.
Workflow Overview
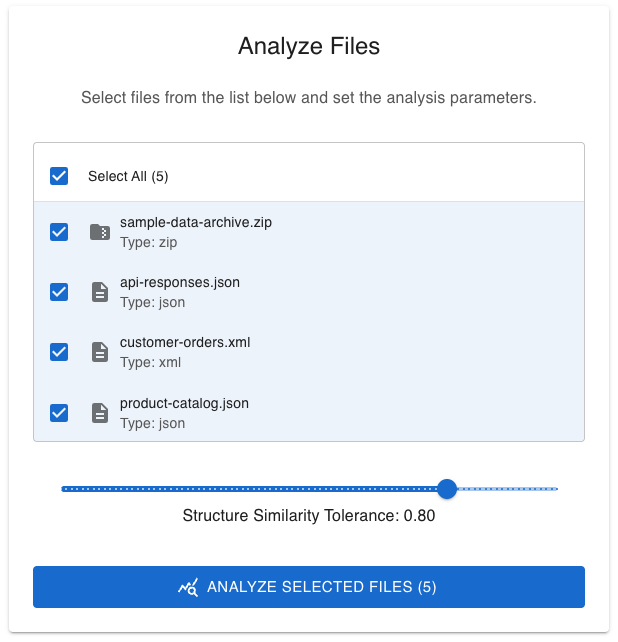
- Select Data Sources: Choose one or more ZIP archives from your uploaded files that contain XML and JSON data. Learn more in File Management
- Configure Analysis Parameters: Set the Structure Similarity Tolerance.
- Run Analysis: Execute the analysis process to automatically detect structures and generate insights.
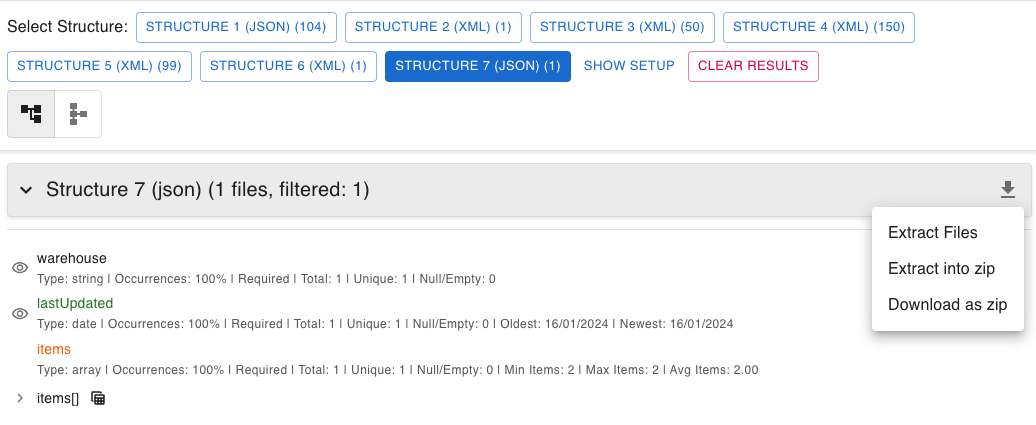
- Explore Structures: Switch between list view and similarity diagram to understand your data organization. See File Viewing for display options
- Interactive Filtering: Use the tree view and associative filtering to explore data relationships and patterns.
- Export Results: Save filtered data or analysis findings for further use. Use Data Extractor for specific data extraction
Core Features
Intelligent Structure Discovery
The module automatically analyzes your XML and JSON files to detect and group them by structural similarity.
- Automatic File Grouping: Files are intelligently analyzed and grouped into distinct structural types based on their content organization.
- Tolerance-Based Grouping: Configure how strictly or leniently files are grouped using the Structure Similarity Tolerance setting.
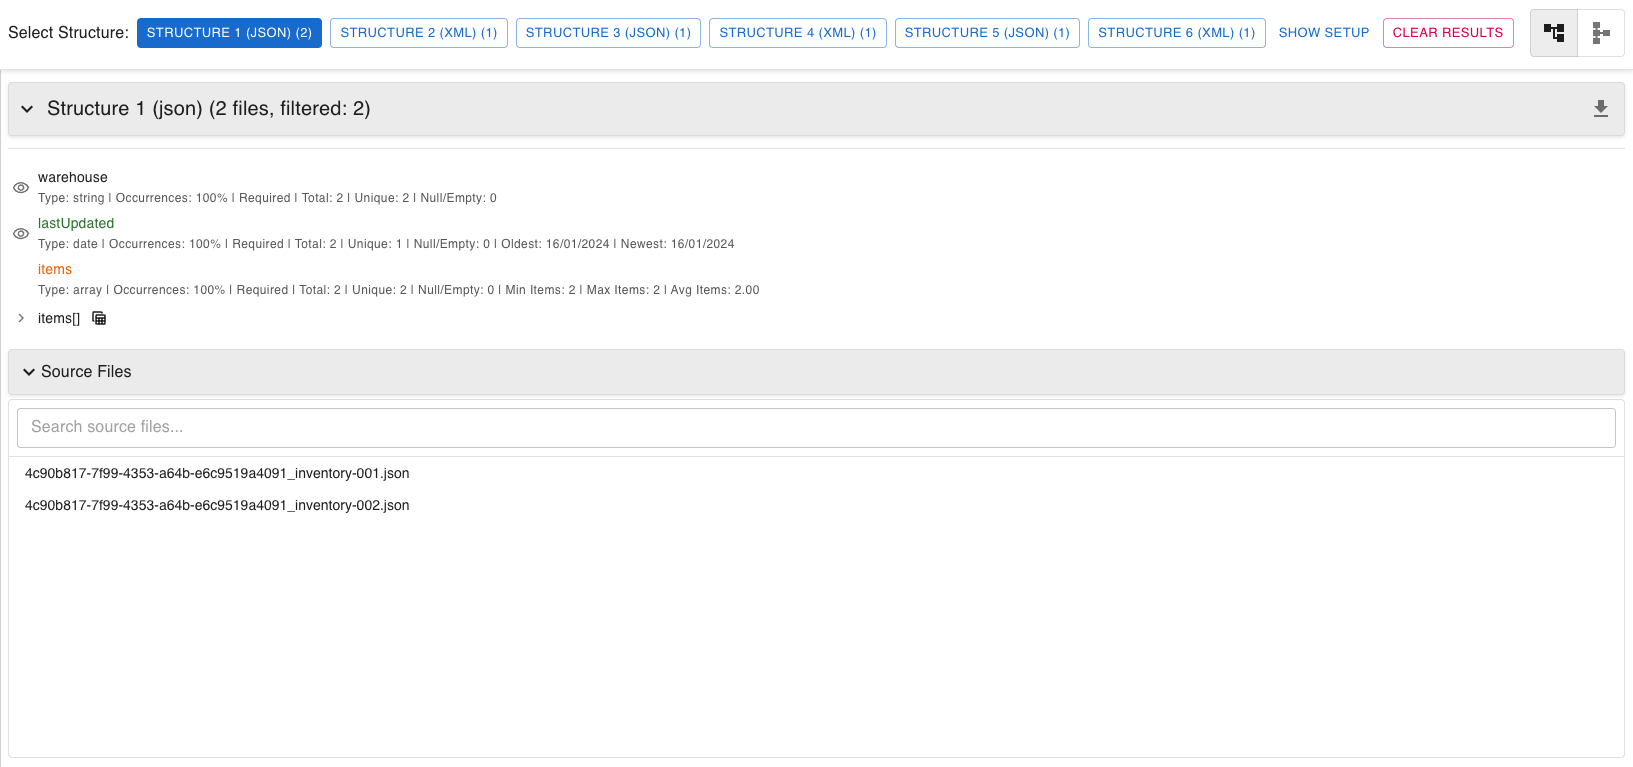
- Dynamic Schemas: For each group of files, a comprehensive schema is generated showing all attributes/keys and their characteristics.
- Occurrence Insights: Instantly see how often each attribute appears within its structure (e.g., "Field X in 80% of files").
- Optional Field Handling: Fields that vary across your dataset are clearly identified as optional based on occurrence frequency.
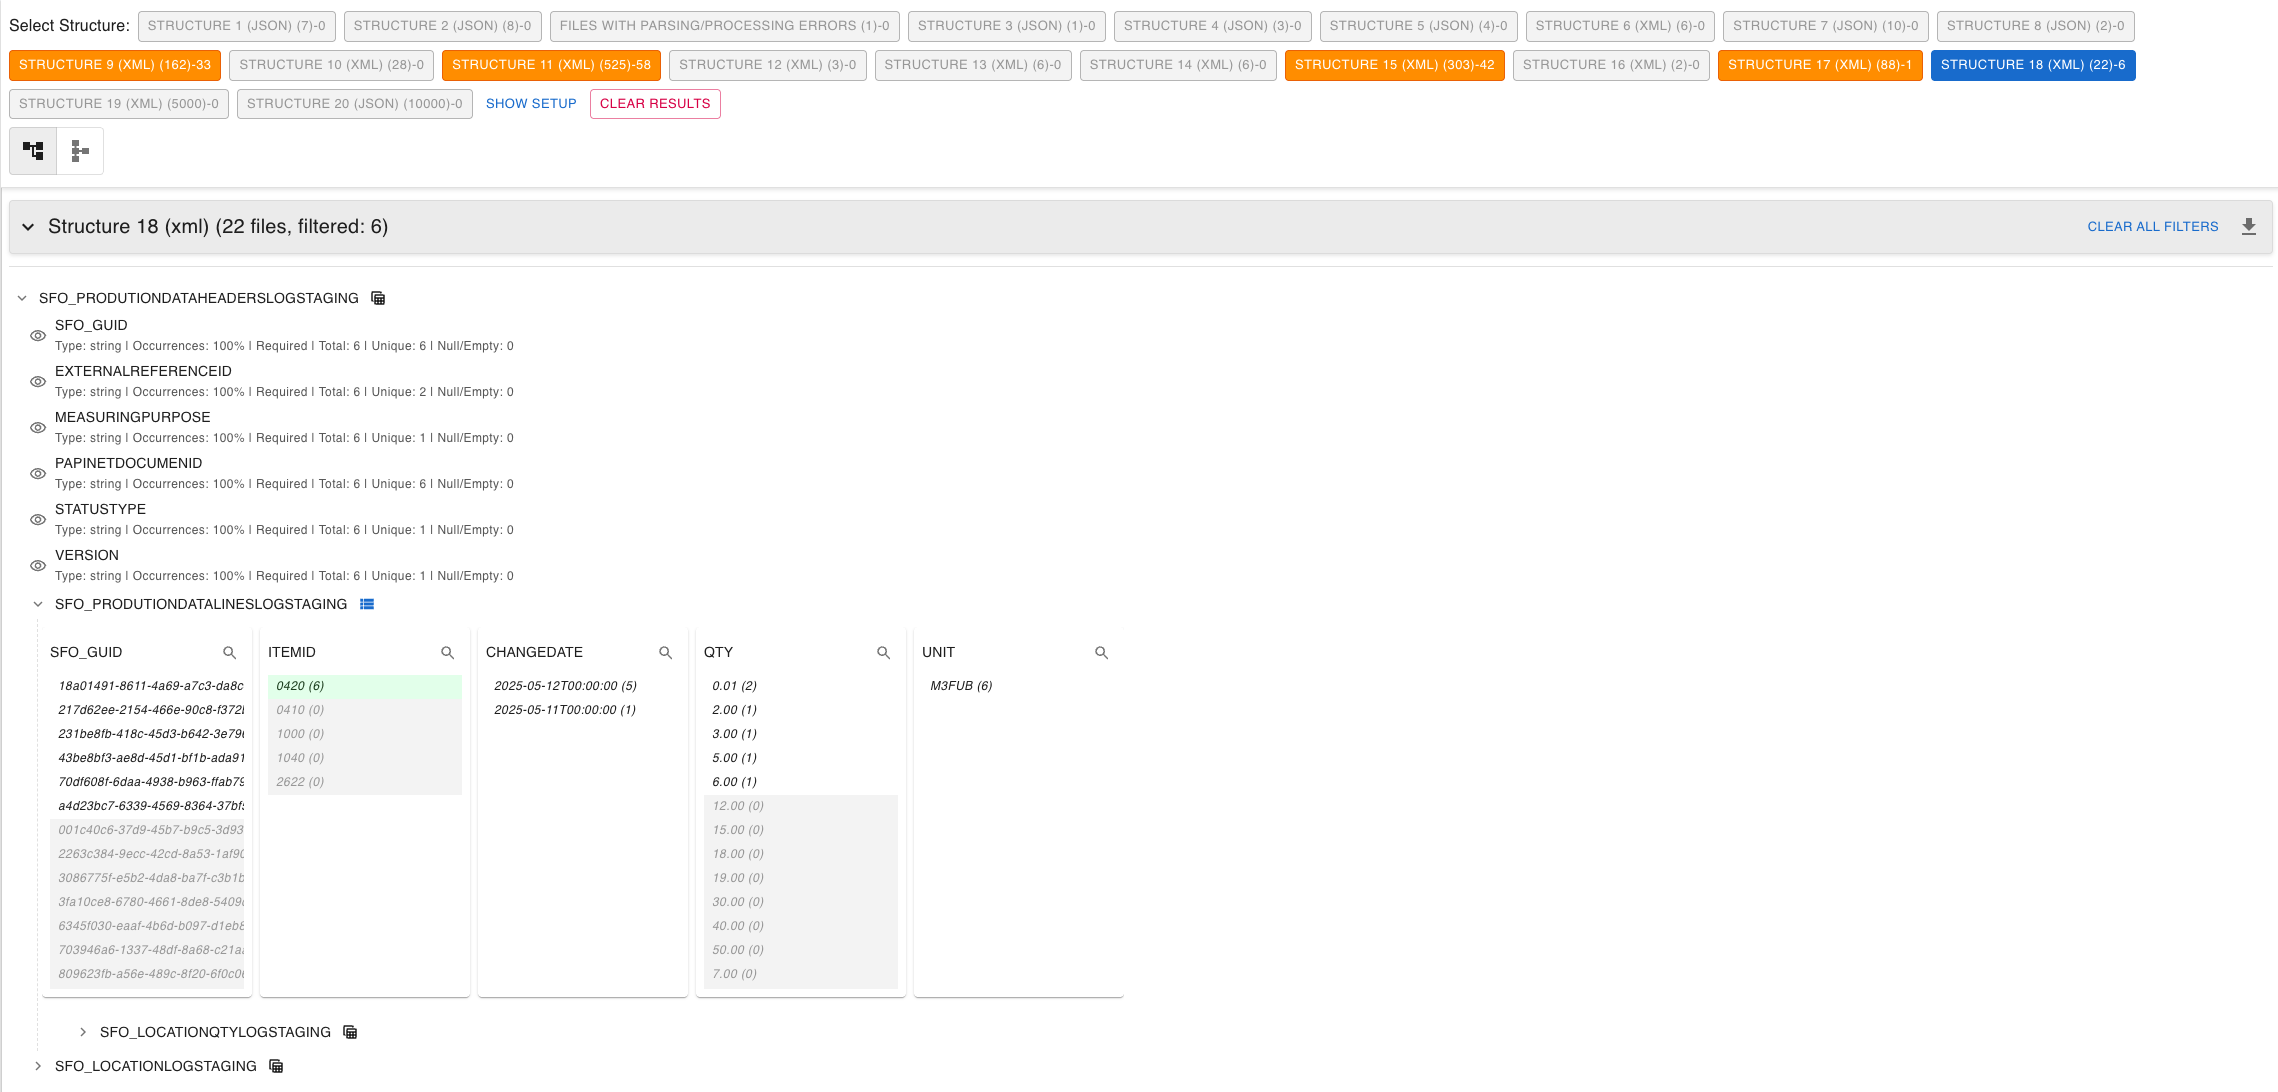
Interactive Data Exploration
Dive deep into your data with powerful visualization and filtering capabilities.
- Hierarchical Tree View: Explore your data's structure with a collapsible tree that makes complex nested structures easy to navigate.
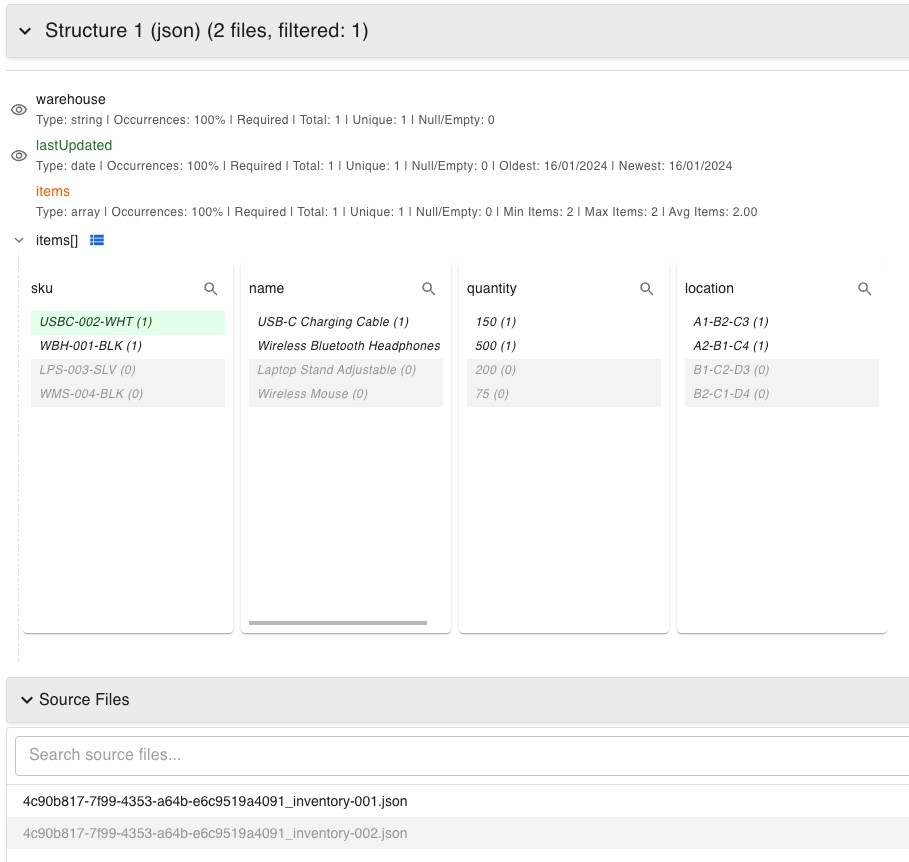
- QlikView-style Associative Filtering:
- Click on values to instantly filter your dataset
- Selected values are highlighted in green
- Related but excluded values are shown in light grey
- Unavailable values (not present in filtered set) are clearly distinguished
- Real-time Counts: Always know how many files or records match your current filter criteria.
- Local Search & Batch Selection: Quickly find values within attribute lists and select all matching values with a single action.
Comprehensive Data Insights
Get immediate statistical analysis without any manual setup.
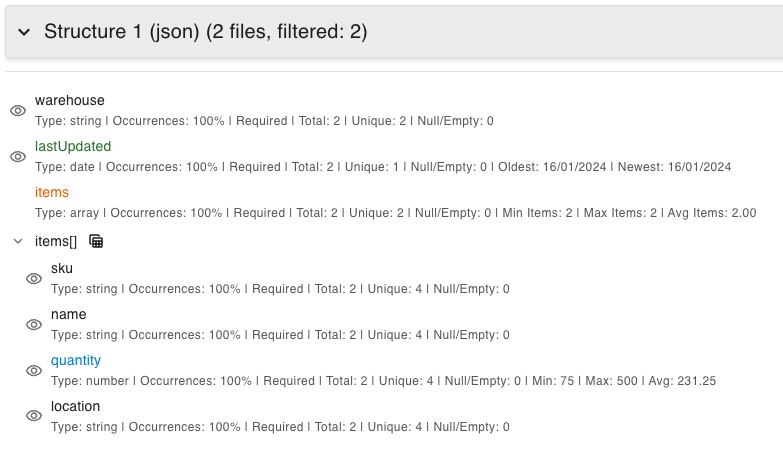
- Automatic Aggregations: For every attribute, see relevant statistics instantly:
- Numbers: Min, max, average, median, sum
- Dates: Earliest and latest dates
- Text: Unique value counts and frequency distributions
- Arrays/Lists: Min, max, and average number of items
- Data Quality: Counts of empty, null, or missing values
- Dynamic Updates: All aggregates refresh instantly as you apply or change filters.
- Data Type Detection: Automatic identification and color-coding of different data types.
Global Cross-Structure Filtering
Analyze relationships across different data structures with advanced filtering capabilities.
- Cross-Structure Analysis: Nodeflip automatically applies filters to equivalent attributes across all detected data structures.
- Attribute Equivalence: The system identifies quivalent attributes across different structures.
- Global Impact Visualization: See how filters affect file counts across all structures simultaneously.
- Unified Filtering Logic: Selected values apply to all equivalent attributes, providing a holistic view of your data.
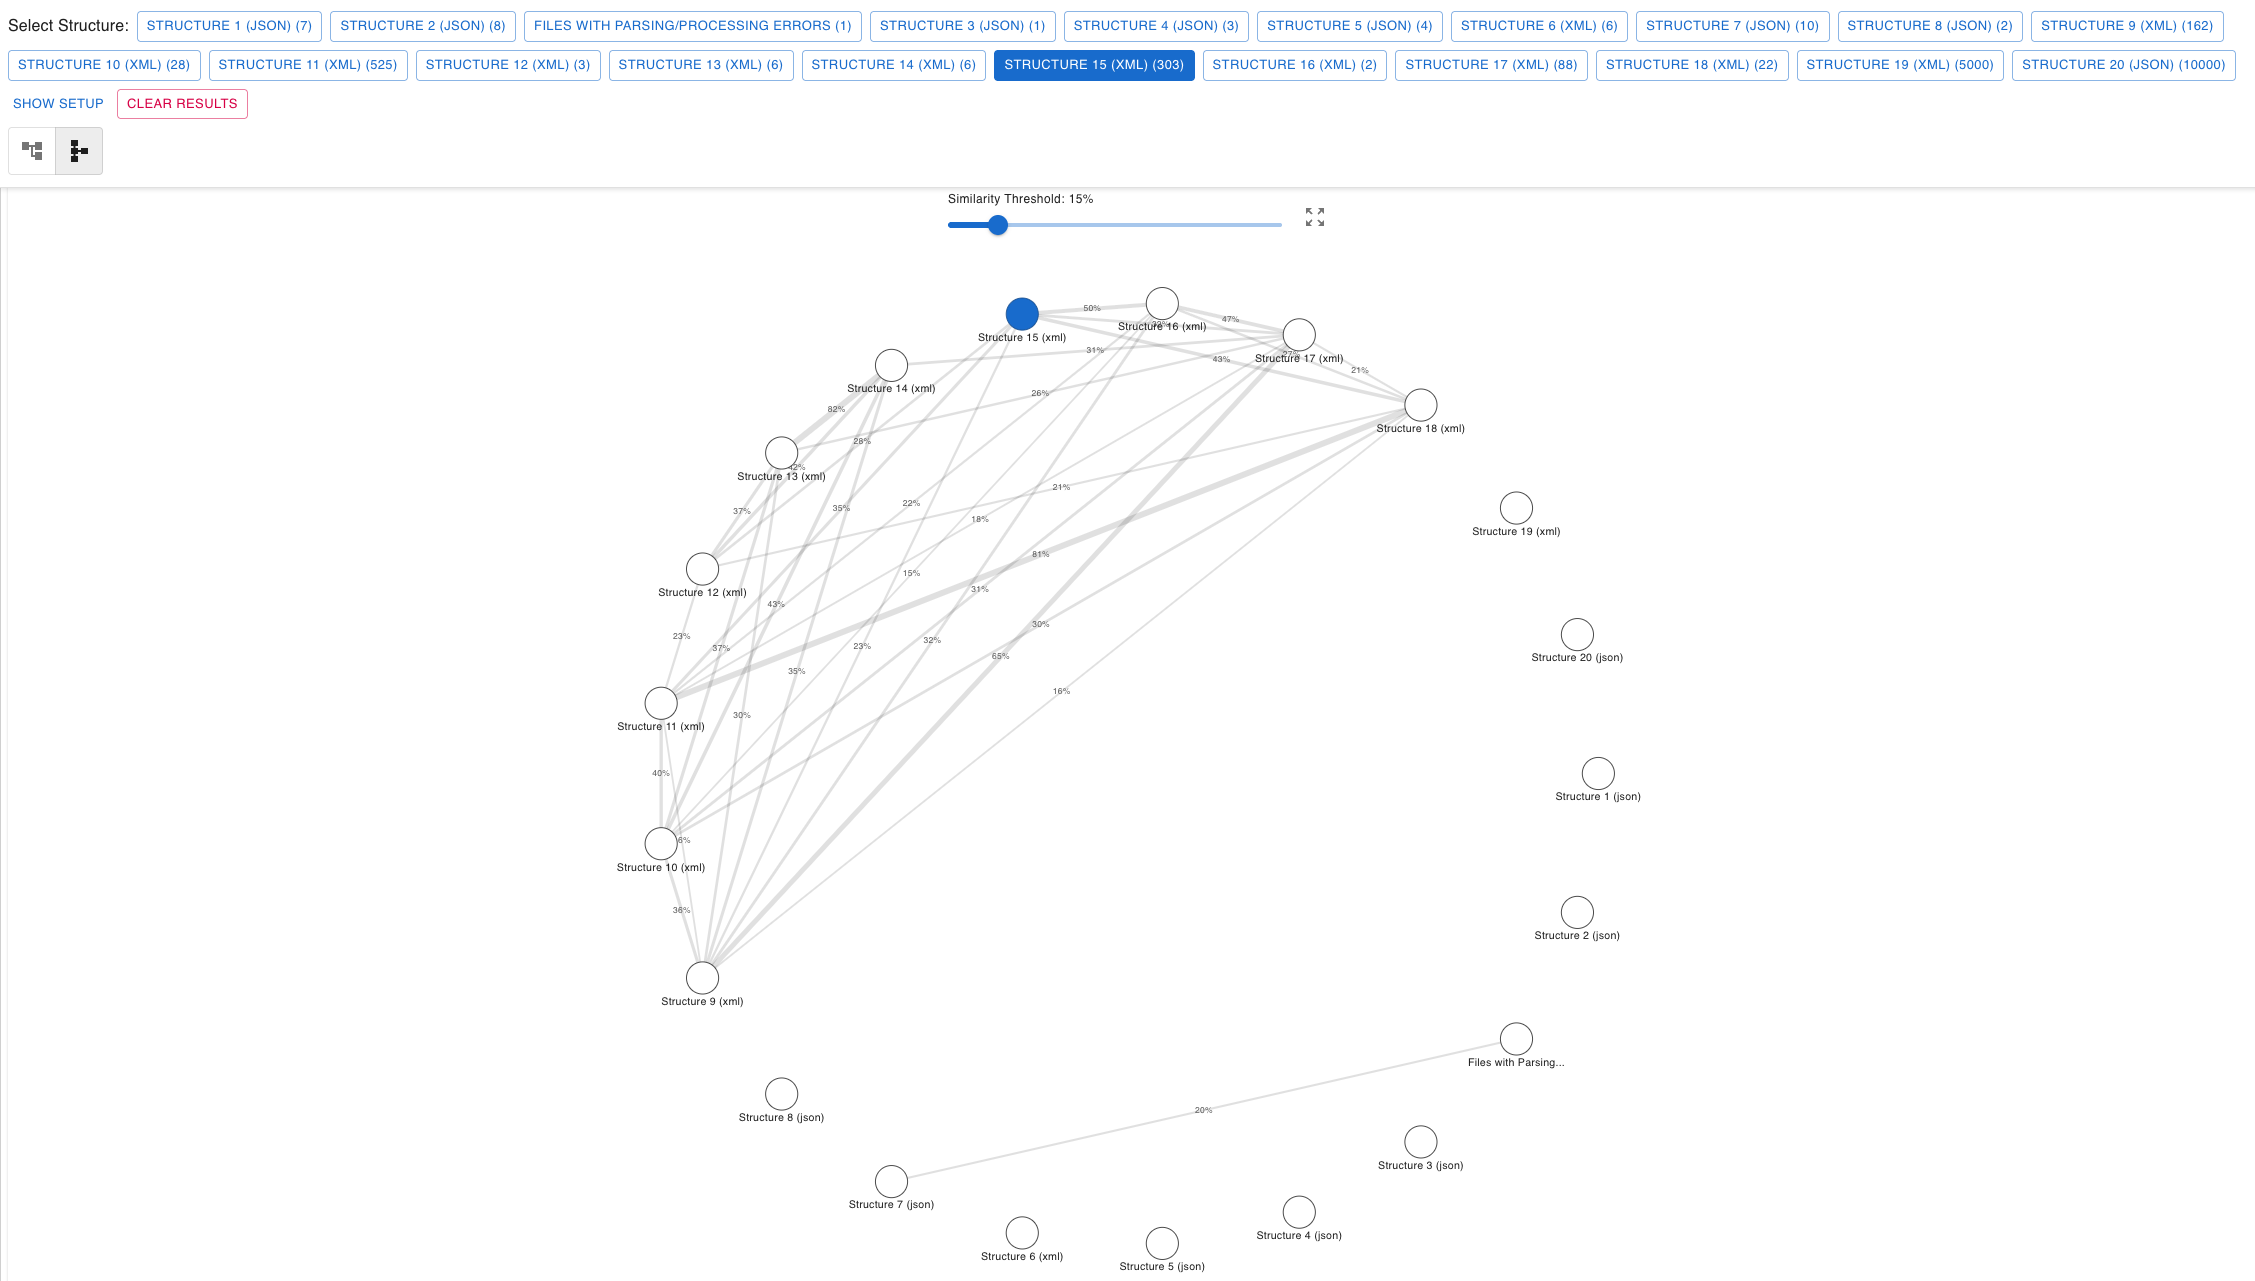
Structure Similarity Visualization
Understand relationships between different data structures with visual diagrams.
- Similarity Diagram View: Toggle between standard list view and a visual diagram showing structure relationships.
- Node-Based Representation: Each detected structure appears as a node in the diagram.
- Similarity Connections: Lines between nodes show structural similarity percentages calculated using the Jaccard index.
- Interactive Selection: Click nodes to select structures for detailed comparison or schema drift analysis.
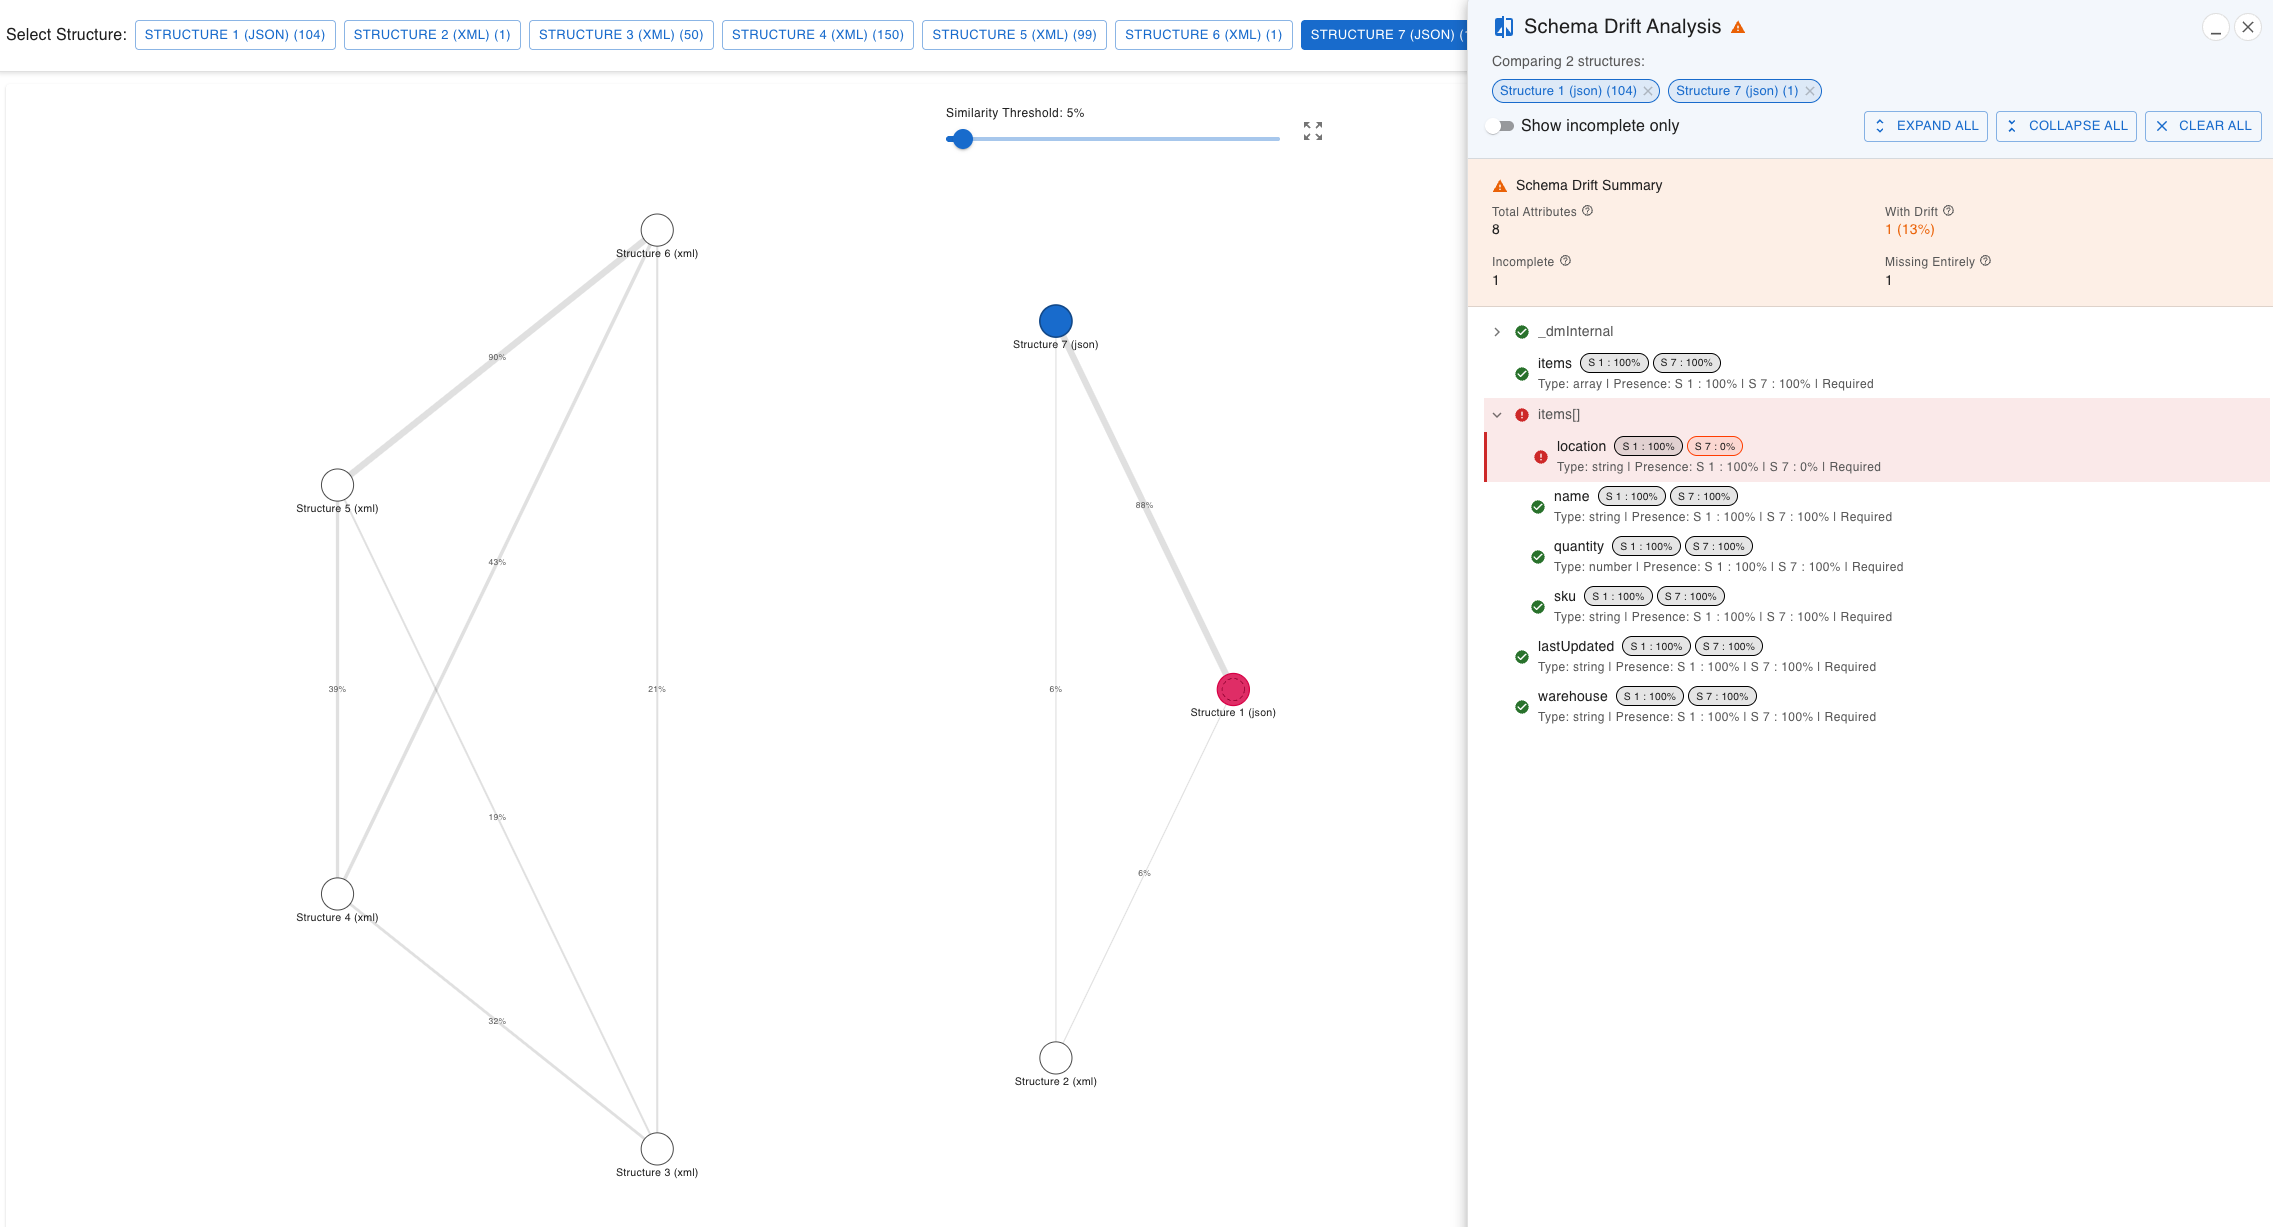
Schema Drift Analysis
Visualize and understand data structure differences across your files with precision. This powerful feature helps you identify inconsistencies, track schema evolution, and assess data quality.
Accessing Schema Drift Analysis
- Navigate to Similarity Diagram: Switch to the diagram view in the Data Analysis module. It is required to have at least two structures detected.
- Open Schema Drift Analysis: Use Ctrl/Cmd + Click to select one or more structures for comparison.
- Automatic Analysis: The Schema Drift Analysis panel opens automatically when structures are selected.
Key Analysis Features
- Drift Summary Metrics:
- Total Attributes: Complete count of unique attributes
- With Drift: Attributes showing presence variations
- Incomplete: Attributes missing from some files
- Missing Entirely: Attributes completely absent from some structures
- Visual Indicators:
- 🟢 Green (100%): Attribute present in all files
- 🟠 Orange (50-99%): Attribute present in some files
- 🔴 Red (0%): Attribute missing from this structure
- Presence Chips: Each structure shows format like 'S 1: 85%' indicating the percentage of files containing each attribute.
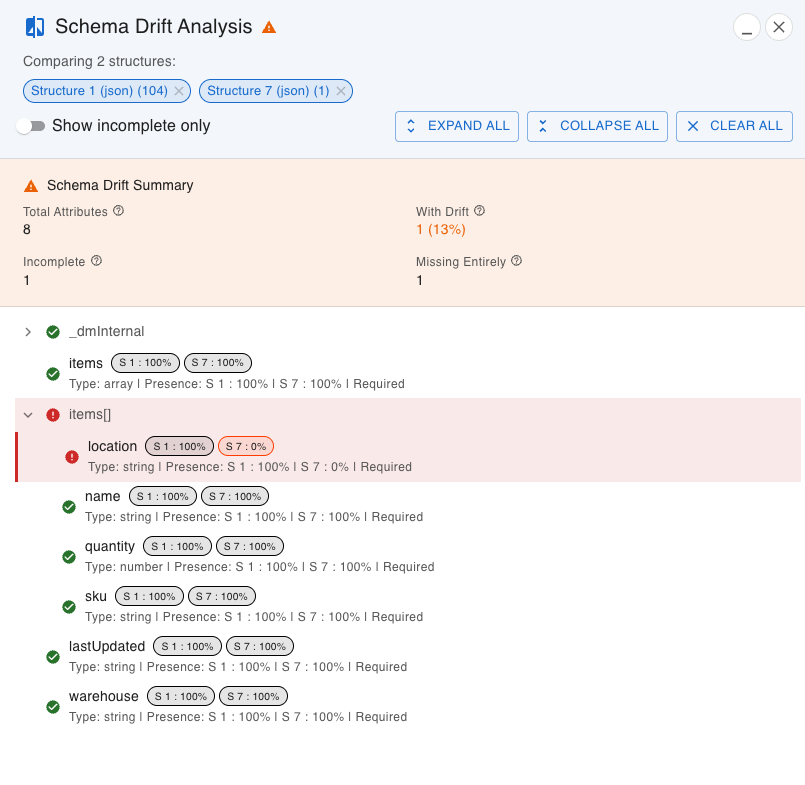
Advanced Controls
- Show Incomplete Only: Filter to display only attributes with less than 100% presence across structures.
- Expand All/Collapse All: Control the tree view expansion for better navigation of complex structures.
- Interactive Tree View: Navigate hierarchical structures with expandable nodes showing drift at each level.
- Resizable Interface: Drag the panel edge to resize for optimal viewing of complex comparisons.
Understanding Structure Similarity
The Data Analysis module uses similarity in two distinct ways to help you understand your data:
1. Initial File Grouping (Structure Tolerance)
When you first analyze your files, the Structure Similarity Tolerance slider determines how similar files need to be to get grouped together.
- Purpose: Controls how strictly files are grouped into "Recognized Structures"
- Process: Each file's internal structure is analyzed to create a "structural signature," then compared against existing groups
- Example: With 80% tolerance:
- file_A.json might be 85% similar to Structure X
- file_B.json might be 95% similar to Structure X
- file_C.json might be 80% similar to Structure X
- All three would be grouped into Structure X
- Result: Each "Recognized Structure" contains files that share similar structural patterns
2. Structure-to-Structure Comparison (Diagram View)
In the similarity diagram, percentages on connecting lines show how similar entire structures are to each other.
- Calculation Method: Uses Jaccard index comparing attribute path sets between structures
- Example Calculation:
- Structure A paths: {user.id, user.name, user.orders}
- Structure B paths: {user.name, user.orders, user.address}
- Common paths: {user.name, user.orders} = 2 paths
- Total unique paths: 4 paths
- Similarity: 2/4 = 50%
- Visibility Control: The diagram's own threshold slider controls which similarity lines are displayed
Data Export & Integration
- Filtered Data Export: Export the exact XML/JSON files that match your current filter criteria.
- Analysis Results: Save analysis findings, schemas, and insights for use in other tools.
- Integration Callbacks: The module integrates seamlessly with the main application for file handling and export operations.
Common Use Cases
API Development & Versioning
- Breaking Change Detection: Identify when required fields become optional or disappear between API versions
- Backward Compatibility: Ensure new versions don't break existing integrations
- Documentation Generation: Auto-generate accurate schema documentation from real API responses. Coming soon.
Data Integration & ETL
- Source Validation: Assess data quality and consistency before integration
- Schema Mapping: Understand structural variations between different data sources
- Quality Assessment: Identify incomplete or inconsistent data that needs special handling
Business Intelligence & Analytics
- Data Reliability: Assess the reliability of data sources before analysis
- Compliance Monitoring: Track data structure compliance across different sources
- Feature Analysis: Understand which data attributes are consistently available for analysis
Database Migration & Modernization
- Legacy System Analysis: Map existing data structures and their variations
- Migration Planning: Plan schema normalization and consolidation strategies
- Validation: Verify migration completeness and accuracy