Data Lineage
This section provides a visual workspace for comparing and tracing data across multiple files side-by-side. It uses a freeform canvas where data sources are represented as draggable and resizable cards. Each card contains an interactive tree view of its corresponding data, allowing for easy comparison and value highlighting across different sources.
Core Features
Canvas Interaction
- Panning: Click and drag the background of the canvas to move the view around.
- Zooming: Use the zoom controls in the bottom-right corner, ctrl/cmd +/-, or touchpad pinch gesture/mouse scroll wheel to zoom in and out. Holding ctrl/cmd while using a mouse scroll wheel or scroll gesture on a touchpad will adjust the zoom level, even if hovering above a scrollable element in a card.
- Reset View: Clicking the button with the current zoom percentage resets the zoom to 100%, and centers the card(s).
- Persistence: The position and zoom level of the canvas, along with the arrangement and state of the cards, are automatically saved and restored when revisiting the Data Lineage section.
Card Management
- Adding Cards (+ Button): The floating blue + button in the top-left opens a dropdown listing all uploaded files. Selecting a file adds it as a new card onto the canvas.
- Arranging Cards: Click and drag the header of a card to move it around the canvas.
- Resizing Cards: Drag the right-hand edge of a card to resize it.
- Closing Cards (X Icon): Each card has a close button in its header to remove it from the canvas individually.
- Removing All Cards (Remove All button): The floating red trash button in the bottom-left removes all cards from the canvas after confirmation.
Data Cards
Each card represents a single data source (file).
- Header: Displays the filename or title of the data source.
- Tree View: Displays the hierarchical data using a tree structure.
- Supports expand/collapse of nodes, either by left-clicking an expandable node, or right-clicking and selecting 'Expand/Collapse all children'.
- Displays keys and values.
- Primitive values (strings, numbers, booleans) are interactive for highlighting.
- Close Button (X): Removes the card from the canvas.
- Filter Input: A text field ("Filter tree content...") allows filtering the tree view within that specific card. You can filter by primitive values (strings, numbers, booleans) or attribute names (keys). Filters applied here can be applied to all cards, by clicking APPLY TO ALL.
- Right-Click Filtering: Right-click on any primitive value to access a context menu with the option to filter all cards by that specific value.
- Clear All Filters Button (Clear Filter icon): Appears near the Add (+) button in the top-left when APPLY TO ALL has been selected. Clicking it clears filters across all cards.
- Right-Click to Copy Value: Right-click on any primitive value to access a context menu where you can copy the value to the clipboard.
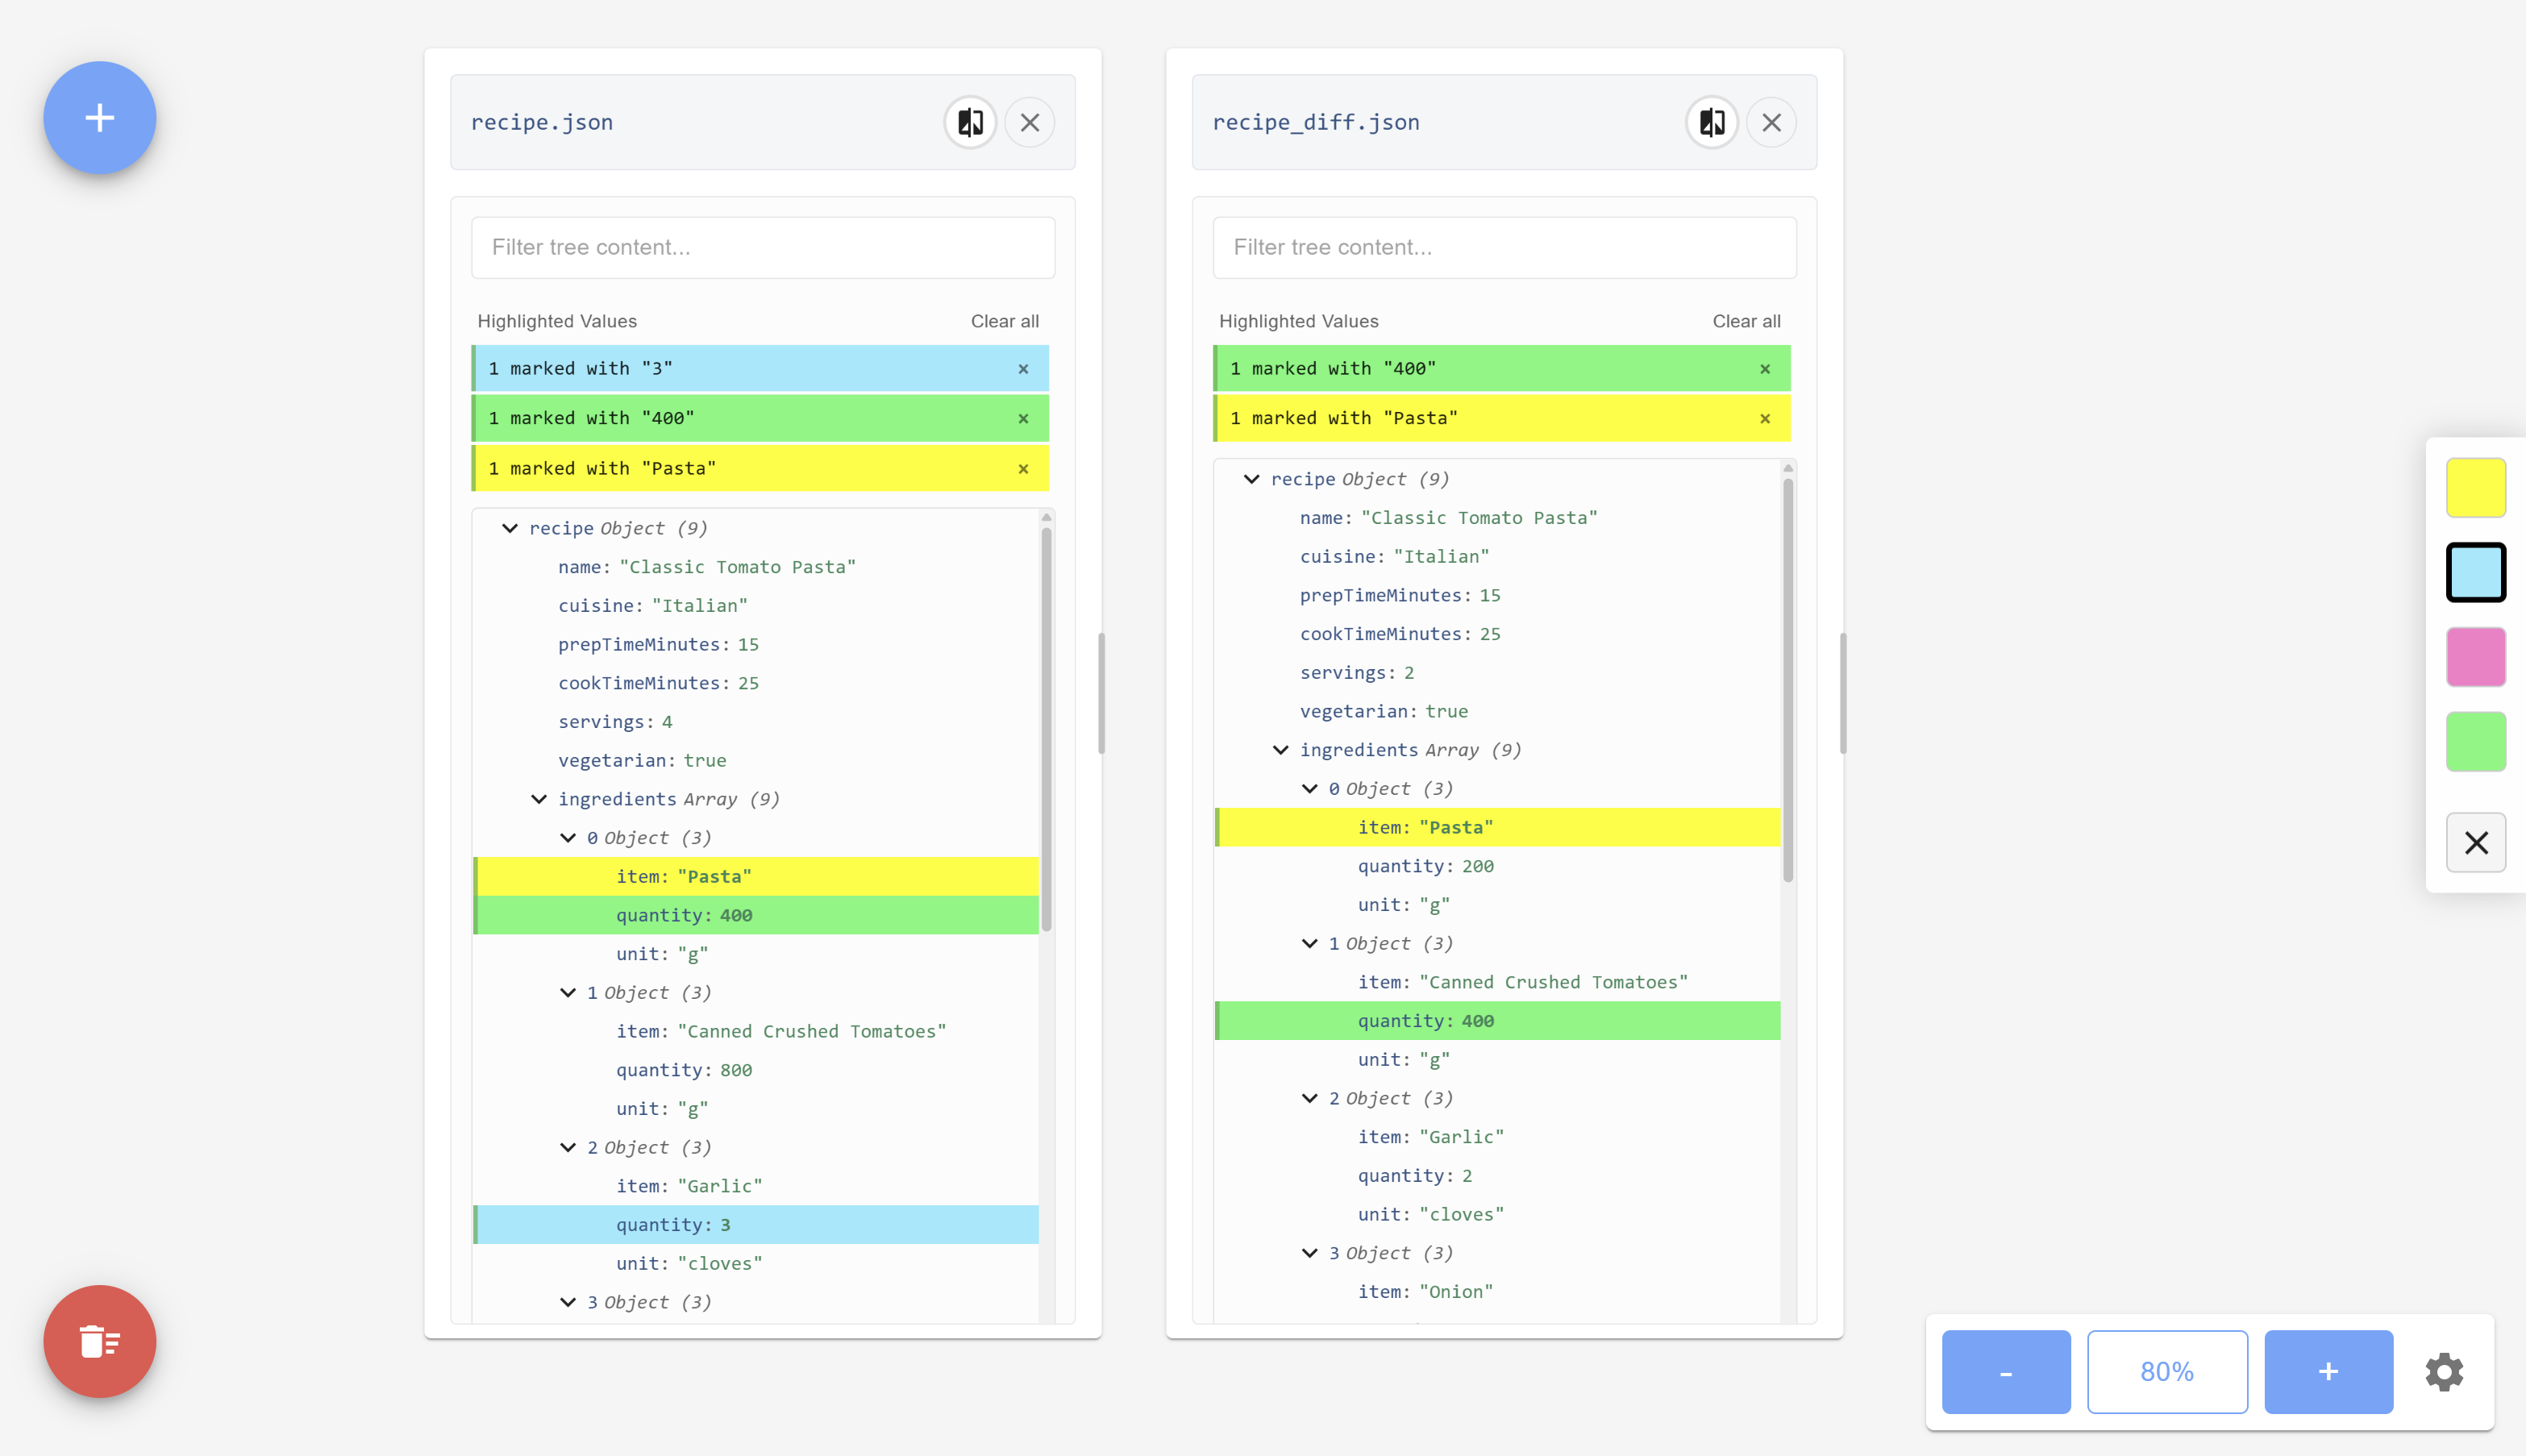
Cross-Card Highlighting (Color Palette)
A floating palette on the right side enables highlighting of identical values across all visible cards.
- Color Selection: Choose a highlight color (Yellow, Cyan, Pink, Green) from the palette. The currently selected color will have a black border.
- Applying Highlights: Click on any primitive value (string, number, boolean) within any card's tree view. All instances of that exact value across all cards will be highlighted with the currently selected color.

- Changing Highlights: Click on an already highlighted value with a different color selected in the palette to change the highlight color for that value everywhere.
- Removing Highlights:
- Click an already highlighted value with the same color selected in the palette to remove the highlight for that specific value across all cards.
- Click 'Clear all' on a data card or the X at the bottom of the palette to remove all active highlights from all cards.
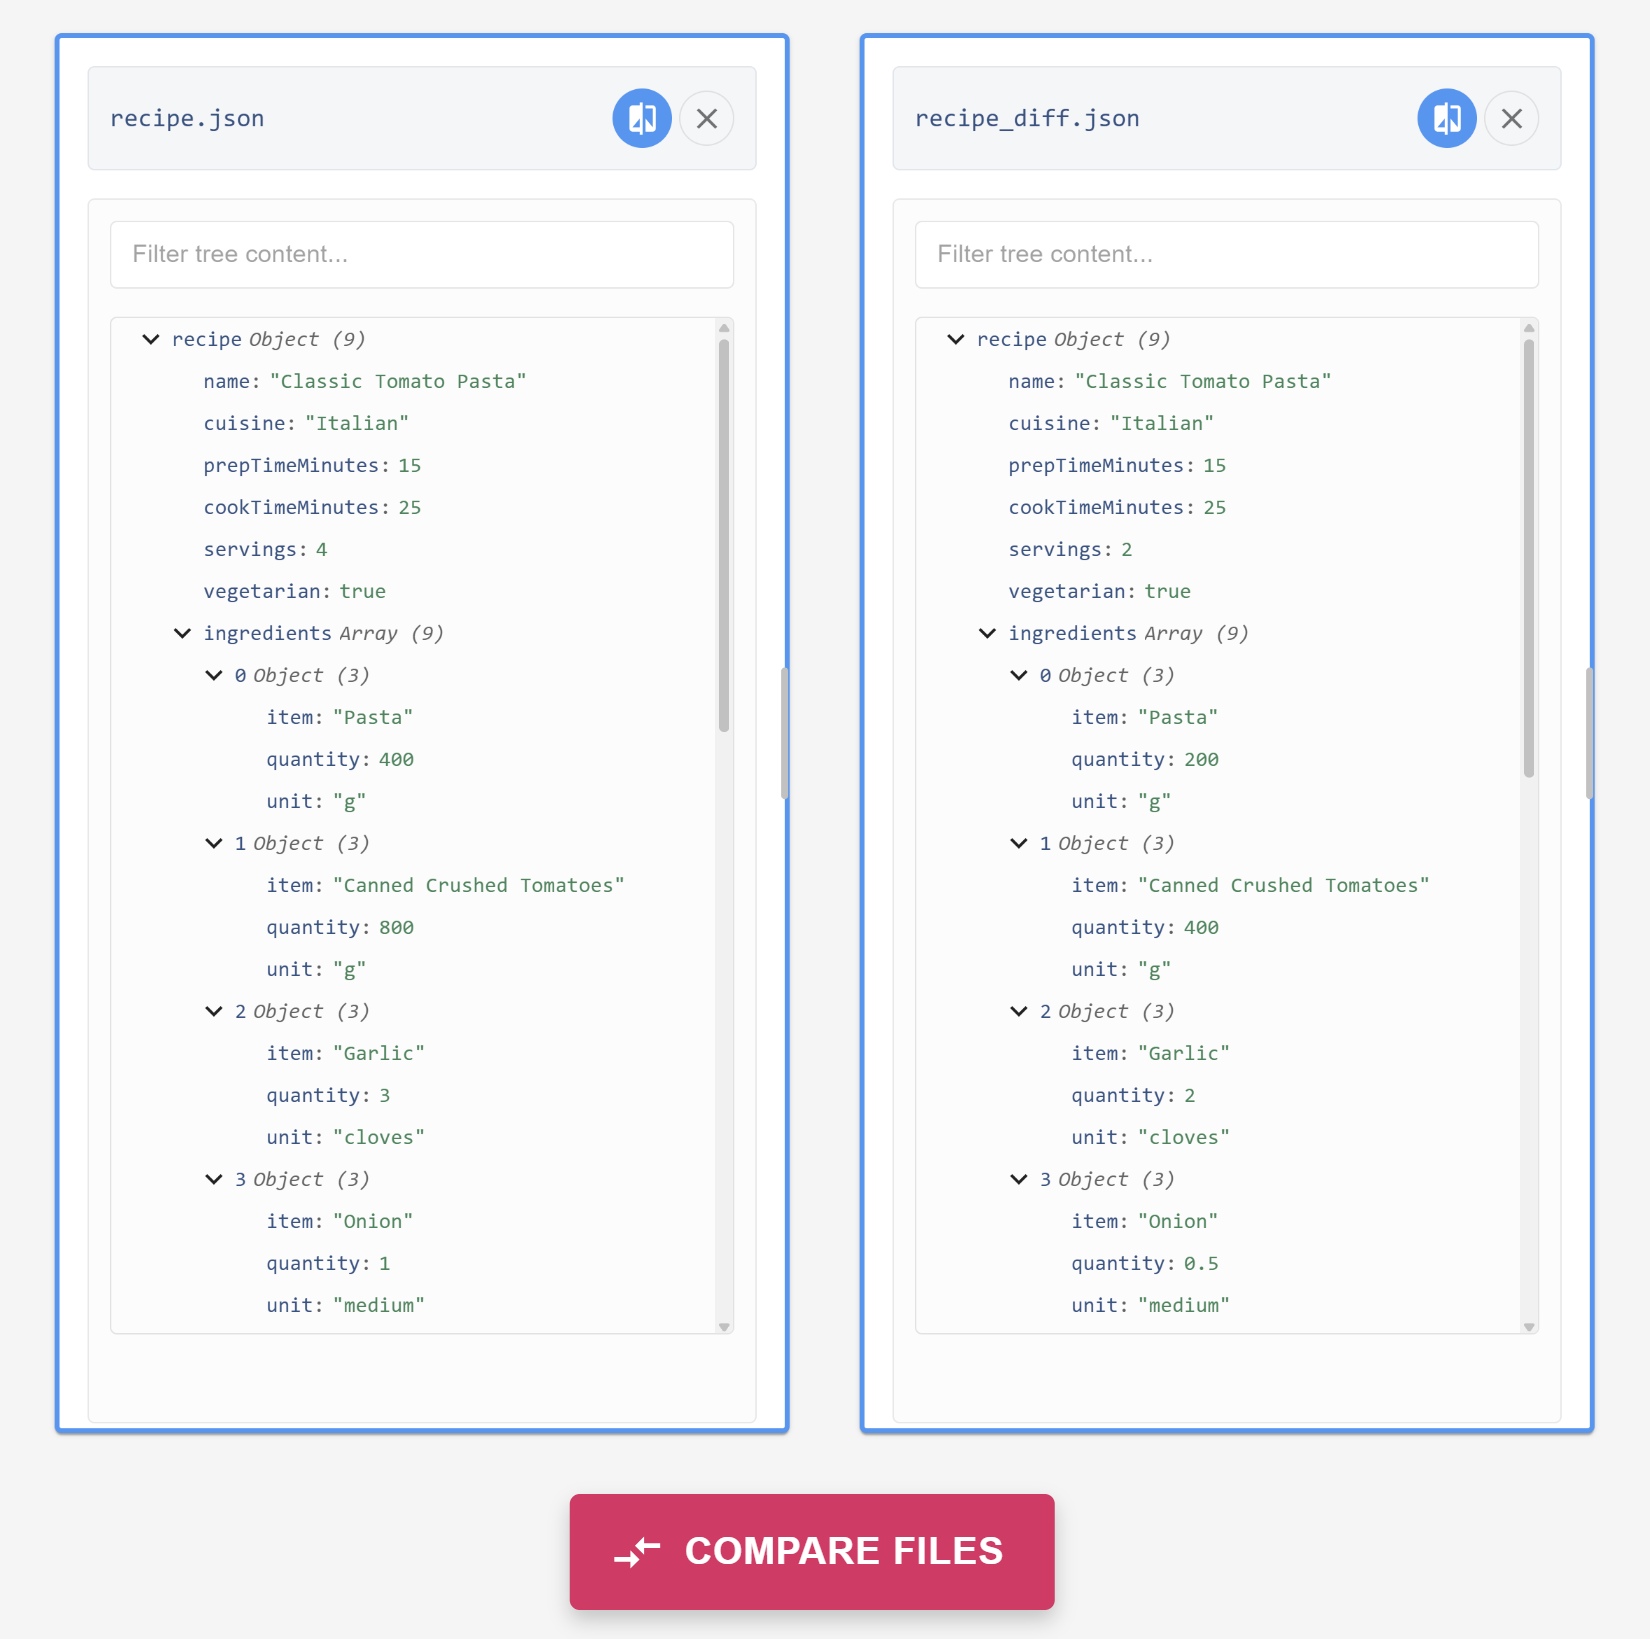
Data Comparison (Diff View)
- Selecting Cards for Comparison: Click on the diff button in the card's header (highlighted in blue in the below image) to select a card for comparison. Selected cards will get a blue outline.
- Comparing Files: A COMPARE FILES button will appear at the bottom when exactly two cards are selected. Clicking this will open a diff view.
- Diff Viewer: Clicking the Compare button opens a full-screen side-by-side diff view showing the differences between the content of the two selected cards, with syntax highlighting.
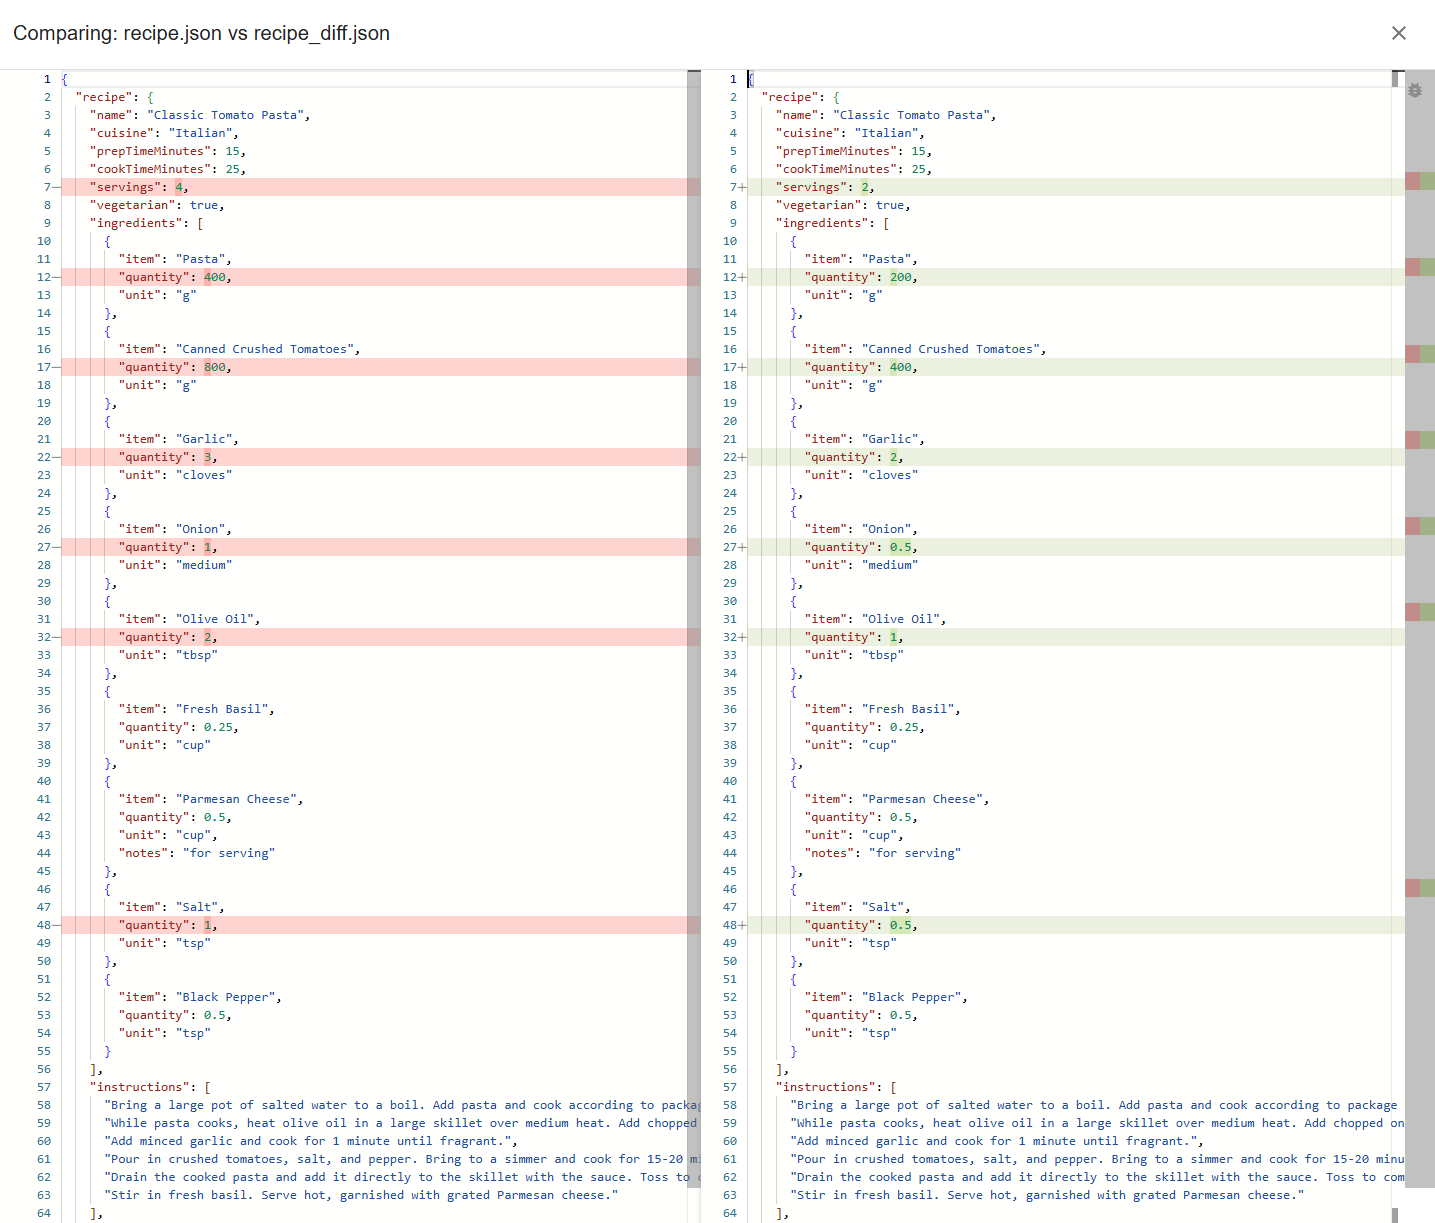
- Closing Diff Viewer: Use the X button at the top-right of the diff viewer to return to the canvas.